Introduction
Modelling in the project is planned to be approached in four aspects: (i)the interaction between particles of γ-PGA and sand grains, (ii) Engineered concrete meeting industry standards, (iii) The long-term viability of γ-PGA as a binder and it’s survivability in the brick making process and (iv) mathematical model for quantifying the amount of γ-PGA in response to the repression promoter.
Particle interaction between γ-PGA and sand particles:
Particle interaction between γ-PGA and sand particles would be have to be simulated to determine the veracity of the project. It is crucial as it would affect the sand stability, mechanical strength, water retention and overall durability of the engineered brick. This simulation could be done using software but as of now, we are not predisposed to access the software. Upon meeting with Chemical Engineering professors specialising in materials and material testing, more light could be shed on what software to use for the simulation of the properties.
Meeting industry standards:
In terms of the engineered product meeting industry standards, certain properties have to be met; these properties are termed index properties. One of the first properties that should be investigated is the grain size distribution of desert sand and how adding the binder would impact it. The ideal prerequisite for sand is for it to be well-graded, with particle sizes ranging from 75µm to 2mm. The proper grading is important as it would impact the binding, and compaction and thus affect the structural integrity. Properties like compressive strength, flexural strength, slump flow, water absorbance, and erosion resistance are key to testing its strength.
The prepared mixtures will be poured into a mould and then undergo laboratory tests. Values from the test will be taken on the 7th, 21st, and 27th day and compared against industry standards and traditionally used materials. Maximum strength and resistance are expected to be seen on the 27th day when about 95% of the water is absorbed. Currently, we are only familiar with software such as:
i) Large-scale Atomic/Molecular Massively Parallel Simulator (LAMMPS): Can be used for Solid-State materials, soft matter (biomolecules), coarse grained and mesoscopic systems [2].
ii) OVITO: Scientific Data visualization and analysis software for particle and molecular interaction. [3]
With more iHP sessions and literature review, more comprehensive software can also be looked at.
The long-term viability of γ-PGA as a binder and its survivability in the brick-making process
Temperature is a crucial factor affecting the degradation of γ-PGA. Degradation of PGA increased at higher temperatures in acidic conditions. The thermal stability of calcium carbonates and aggregates added to the mix is expected to help stabilise the final mix.
Thermal stability is also crucial in building design as it quantifies the heat exchange between the material and the environment. Thermal Stability is determined by the formula:
![Fig3: Plasmid [3].](images/formula2.png)
b-Thermal Stability,
ρ-Density of the material,
c-Specific Heat.
λ-Thermal Conductivity.
Ideally, for the aggregates to attain peak thermal stability, materials should have high density, high thermal conductivity, and high specific heat. [4]
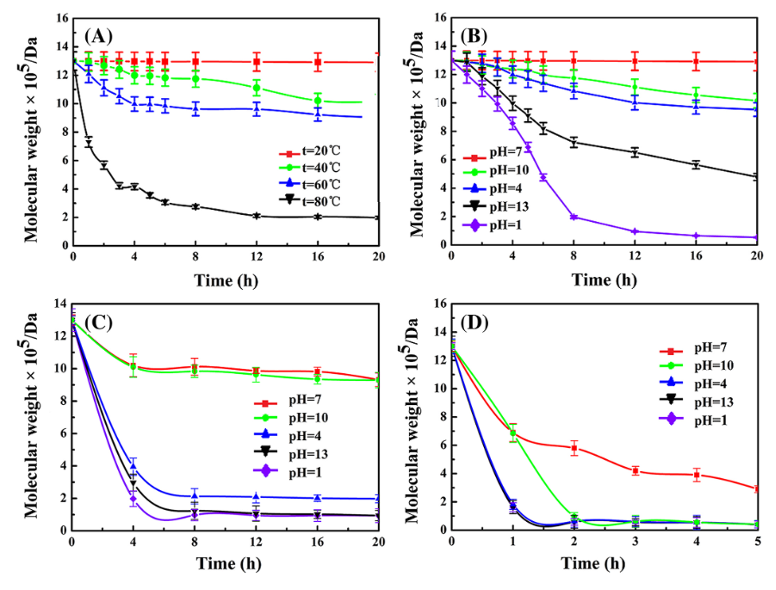
Fig1: Effects of temperature and pH on the degradation of Gamma-PGA
The Mathematical Model for Quantifying the Amount of γ-PGA in Response to the Repression Promoter.
In order to quantify the expression of the binding of repression protein to ggt gene resulting in enhanced production of γ-PGA, a system of ordinary differential equations (ODEs) could be created. The genetic component of this system includes Plasmid PBGSC6. The rate constants for the model could be adopted from existing literature. The graph to assess the yield could be plotted from MATLAB.
We are looking at the repression of that codes for the degradation of γ-PGA.
![Figure 2-Fig 2: ggt gene from NCBI [5]](images/ggtgene.png)
Figure 2-Fig 2: ggt gene from NCBI [5]
![Figure 3- Promoter Prediction [6]](images/promoterprediction.png)
Figure 3- Promoter Prediction [6]
Timeline(estimated)
1. Promoter sequence comparison between B.licheniformis WX-02 and B.licheniformis ATCC14580: 2 weeks*
2. Developing siRNA from protocols for ggt repression: 3 weeks*
3. Mathematical model for predicting yield increase on gene repression: 1 month.*
4. Promoter replacement for enhancement of γ-PGA production: 1 week.
5. Mathematical model comparing yield : 2 weeks.
6. Software modeling to understand the chemical interactions between sand grains and γ-PGA: 2 weeks.
7. Molecular dynamic studies for the stability of the mix: 3 weeks
*1,2 and 3 occur parallelly.
References
- [1] Tingting Xu, Shuyue Zhan, Meihui Yi, Bo Chi, Hong Xu, Chun Mao, Degradation performance of polyglutamic acid and its application of calcium supplement, Polymers for Advanced Technologies, Volume29, Issue7,July 2018,
https://doi.org/10.1016/j.jbiotec.2019.08.003.- [2] LAMMPS Molecular Dynamics Simulator
https://www.lammps.org/#:~:text=LAMMPS%20has%20potentials%20for%20solid,%2C%20meso%2C%20or%20continuum%20scale.- [3]About OVITO-
https://www.ovito.org/manual/introduction.html- [4]Zaborova, D., Vieira, G., Musorina, T., Butyrin, A. (2018). Experimental Study of Thermal Stability of Building Materials. In: Murgul, V., Popovic, Z. (eds) International Scientific Conference Energy Management of Municipal Transportation Facilities and Transport EMMFT 2017. EMMFT 2017. Advances in Intelligent Systems and Computing, vol 692. Springer, Cham.
https://doi.org/10.1007/978-3-319-70987-1_51- [5]GGT gene -
https://www.ncbi.nlm.nih.gov/nuccore/CP000002.3?report=graph- [6]Promoter Prediction -
https://www.fruitfly.org/cgi-bin/seq_tools/promoter.pl - [2] LAMMPS Molecular Dynamics Simulator